
Waveforms and playback: what changes between headphones and speakers
How a sound is generated in a circuit or file is only half of the acoustic story. Whether you listen through stereo headphones, room loudspeakers, or a mono speaker determines whether left and right channels stay isolated, mix in the air, or sum electrically.
1. How to read time-domain and spectral plots
The figures in this guide are analytical or illustrative models computed from mathematical equations, not measurements of a particular playback system. Reading them accurately requires checking four structural elements on each figure:
- Horizontal axis and units: Time t in milliseconds (ms) or seconds (s) for waveforms; frequency f in hertz (Hz, often on a logarithmic scale) for spectral plots.
- Vertical axis and normalization: Normalized instantaneous amplitude (-1.0 to +1.0), channel gain (0.0 to 1.0), or relative power spectral density in decibels (dB) referenced to 1 kHz.
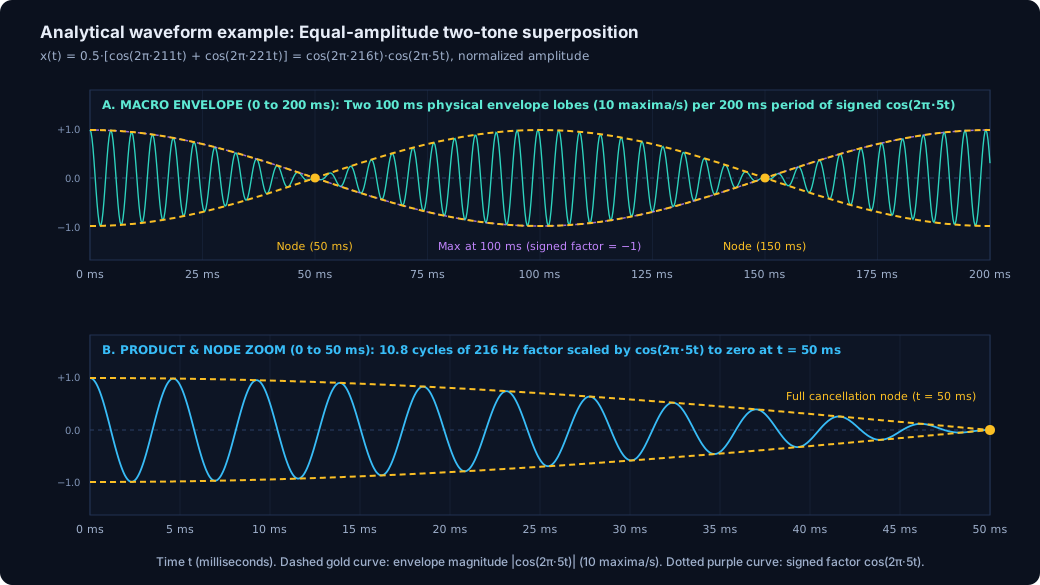
- Physical waveform vs. envelope overlay: Rapid oscillations show the audible carrier wave, while dashed or solid outer curves trace the slower amplitude envelope E(t).
- Left vs. right stereo channels: Separate traces show whether modulation already exists inside a single channel or only appears when two channels are compared or mixed.
2. What changes between stereo headphones, speakers, and mono playback
The acoustic signal that reaches the eardrums depends on both the generated audio channels and the playback path. Stereo headphones isolate the left and right ears, whereas open-air loudspeakers radiate into a shared room where sound from both speakers reaches both ears (acoustic crossfeed) and interacts with room reflections (Hartmann, 1997; Moore, 2012).
| Sound family | Stereo headphones | Stereo loudspeakers in a room | Mono downmix or single speaker |
|---|---|---|---|
| Binaural beats f1 Left, f2 Right |
Preserves separate channels: Each ear receives an unmodulated sine wave; the beat percept arises from central binaural interaction. | Mixes channels in the room: Acoustic crossfeed between speakers partially sums f1 and f2 in the air, converting part of the stimulus into a physical monaural beat alongside room reflections. | Converts to a physical monaural beat: An averaging mono downmix M(t) = 0.5·(L + R) produces 0.5·[cos(2π·f1·t) + cos(2π·f2·t)] (or an unattenuated sum L + R doubles the peak excursion), creating a physical amplitude-modulated wave. |
| Monaural beats f1 + f2 in same channel |
Delivers the modulated signal to the ear: Both tones are summed in the same channel before the transducer (subject to headphone fit and response). | Radiates the modulated signal into the room: The source signal carries the |f2 - f1| modulation, though room standing waves, reflections, and speaker frequency response can alter the relative balance of the two tones and the depth of the envelope at the listener's ears. | Preserves the source modulation: For identical left and right channels (L = R), an averaging mono downmix 0.5·(L + R) preserves the original signal level (0 dB change), whereas an unattenuated sum L + R doubles amplitude (+6.02 dB) without altering the beat rate |f2 - f1|. |
| Isochronic tones Periodic amplitude pulses |
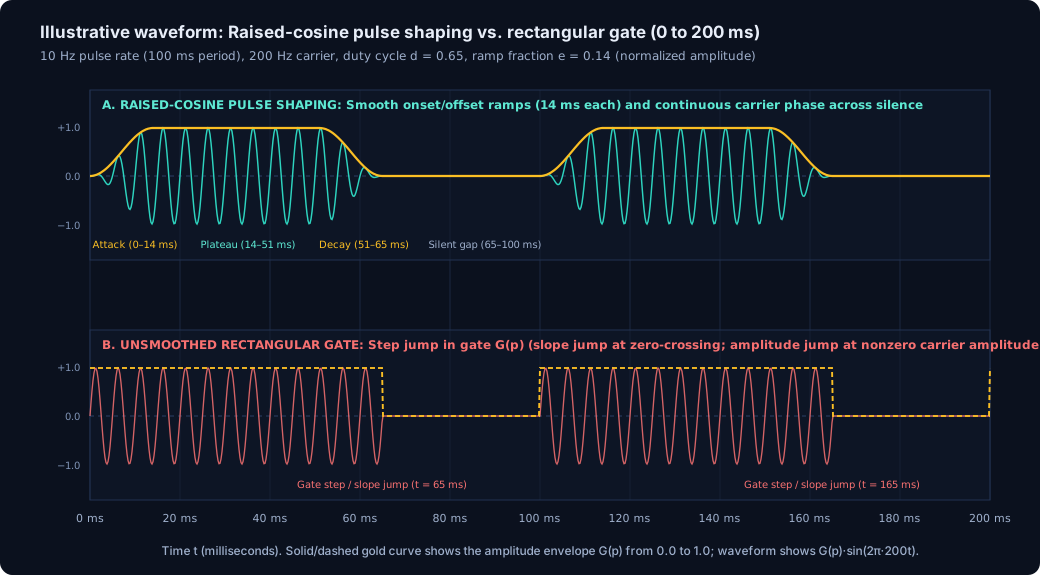
Delivers the pulse envelope to the ear: Onset/offset ramps and quiet gaps are reproduced directly at the ear canal without room reverberation. | Radiates the pulse train into the room: The source signal retains the periodic pulses, while room reflections and reverberation can partially fill in the quiet intervals between rapid pulses at the listening position. | Preserves the source pulse train: Single-channel or identical-channel pulses retain their repetition rate and duty cycle in the electrical signal. |
| Alternating & bilateral tones Left ↔ Right panning or pulses |
Preserves full left–right separation: Events alternate cleanly between the left and right ears. | Narrows spatial separation: Both ears hear both speakers with interaural level and time cues, creating a narrower left–right stage in front of the listener. | Removes the left–right movement: Summing L and R collapses spatial alternation into a centered stream; whether the mono level stays flat or dips/peaks at center depends on the panning law (linear vs. constant-power) and whether the two channels carry phase-aligned carriers. |
| Colored noise & soundscapes | Maintains stereo separation without room reflections: Delivers independent left–right spatial textures directly to each ear, while perceived tonal balance depends on the headphone transducer, acoustic seal, and any device signal processing. | Shapes spectrum via speaker & room response: Perceived low- and high-frequency balance depends on the loudspeaker's frequency extension, placement, and room acoustics, while room reflections blend stereo soundscapes. | Collapses stereo width: For an unattenuated sum L + R of two equal-level channels, independent (uncorrelated) noise sources add in power (+3.01 dB RMS), whereas identical (correlated) signals add in amplitude (+6.02 dB). Under an averaging downmix 0.5·(L + R), identical channels stay at 0 dB while uncorrelated noise drops by -3.01 dB RMS. |
3. Analytical waveform and spectral diagrams across the six families
Each diagram below illustrates the mathematical structure of one sound family using explicit time or frequency axes and normalized scales.
A. Dichotic binaural presentation vs. physical linear sum (0 to 100 ms)

B. Monaural two-tone superposition and carrier zoom (0 to 200 ms & 0 to 50 ms)
C. Isochronic pulse shaping: Raised-cosine ramps vs. rectangular gate (0 to 200 ms)
D. Continuous stereo panning vs. alternating left–right pulses (0 to 1000 ms)

E. Idealized power spectral density (PSD) slopes of noise colors (20 Hz to 20 kHz)

F. Procedural soundscape macro-envelopes and filter modulation (0 to 25 s)
